
Coding the Heydar Aliyev Centre in Grasshopper (Part 1)
- lewisbond1997
- Jun 9, 2021
- 2 min read

Updated: Jun 14, 2021
Over the next three blog posts I will describe and analyse the process of coding the Heydar Aliyev Centre in Rhino giving examiners a more comprehensive view of the process involved
Beginning with a simple closed curve in Rhino, a surface command is added to represent this. The set one surface option connects the Grasshopper command to the rhino surface.

Add quad panels to create quadrilateral panels (divisions) across the surface with number sliders U (horizontal) V (vertical) allowing me to change the number of divisions (panels) applied to the surface. These panels appear in Rhino as a collection of untrimmed surfaces.


By simply adding a join command we can then connect all untrimmed surfaces.
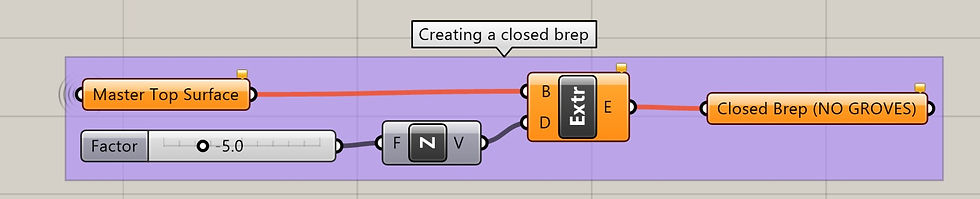
A data point is a collection of all previous outputs along the code tree. Almost like a save file of all command results up to this point. I have named this 'Master Top Surface’ to make identifying what the data relates to more convenient.

The ‘Master Top Surface’ data point is then used to extrude the surface; however, I did not use this in the end as the shape of the building created irregularities in thickness. Instead opting to 'Bake' the ‘Master Top Surface’ into Rhino. As this was not a polysurface the Mesh command is used, followed by the MeshtoNURB command resulting in a workable polysurface.
For the lower branch of panelling as seen in the image below, I used a data point to represent the Brep that was then named ‘Surface’. Brep being a wider term used for surfaces and solids. More commonly referring to the latter.
The DeBrep command allows me to isolate the edges of each panel. Followed by a data point to store this information named ‘Edges’.


Item 0 highlighted in green
The item command retrieved the edges as a list of information. One list representing one panel. (a collection of four edges.) Connecting a slider containing the number of panel edges which is then connected to the item index allows me to select the first item in every list. This being the first edge of each panel.

Flattening this information places all items (the first edge of each panel) on the same list. If this wasn't flattened, I would have one item on each list, so 16 lists (representing the number of panels).

Firstly, I need to work out which items on my list need to be selected and joined to create a continuous curve. In this instance, the first line would be 0, 4, 8 and 12. The second 1, 5, 9, 13 and so on.

The first line in this example would be made up of items (edges) 0, 4, 8, 12
This information could be hard coded into Grasshopper using specified inputs. However, as the divisions may need to be changed further down the line, I want the code outputs to be driven by variable parameters. In more manageable terms, allowing me to edit the number of panels without breaking the code.

Example of how this information could be hard coded


Comments